One site took every M-League game record since the league started, 2,028 games and 24,733 hands, and asked how much of the standings is skill. I hadn't seen that done in English before. The answer it publishes: about 88% of the gap between players over one season is luck, and no less than 72%. The site is M Data Lab, it's unofficial and free, and its operator wrote to me this week asking to be listed as a resource. I read the methodology and the validation pages before I said yes.
Who runs it and what it reads
Whoever runs it signs as the site's operator and has no tie to the league, its teams or its players. The data comes from M League Haifu, the public hand-by-hand game records that a volunteer, konoui, publishes, imported with konoui's MIT-licensed database. M Data Lab recomputes every result under the league's rules, 25,000 start, 30,000 return, place points of +50 for first (counting the 20-point bonus for the winner), +10, -10 and -30, no bust, and checks the totals against the official records. It leaves out 23 hands with faulty records from the style and luck metrics.
The English version has the standings odds, the player pages, the rankings, a Tenhou-style rating, and a page for every game. The methodology, the validation and the columns are Japanese only.
Pull everything toward the average
Mahjong results are skill plus luck, and a short record can't tell you how much of each. The site's answer is the one baseball uses for a batting average in April. A player's skill estimate blends their record with the league average. The games played, n, is the weight on the record. A number the site calls k is the weight on the average: the games it takes for that metric to be half skill. At n = k the two weigh the same:
estimate = (n × record + k × league average) / (n + k)
For points per game, k is about 170. The site's own example is Sasaki Hisato (KONAMI Mahjong Fight Club), the pro with the most games in the league: 313 career games at +3.5 points per game becomes an estimate of +2.3, with his record carrying 65% of the weight. The same formula pulls Setokuma Naoki's (TEAM RAIDEN, the individual leader) +40.5 per game this season, over 11 games, to an estimate of +2.5. Don't read an estimate near zero as "average player". It says the data can't yet separate the player from the average.
Style shows in five games, results take 170
Everything on the site rests on k, and k differs by metric. From the column on luck and skill:
| Metric | Games to half skill, about | 90% interval |
|---|---|---|
| Call rate | 5 | 4 to 9 |
| Win rate | 66 | 40 to 223 |
| rate | 68 | 41 to 249 |
| rate | 72 | 50 to 141 |
| Points per game | 170 | 61 to no upper end |
| Average placement | 173 | 62 to no upper end |
Read the last column. For points and placement, the interval has no upper end. In the site's words, the data cannot rule out that the differences in average place between pros are all luck. A player's is half settled after five games and the interval is tight. Whether someone calls or stays closed is a fact about them. Where they finished this season is mostly luck.
Measured luck: the deal, the draws and the ura dora
M Data Lab also measures the luck it can see in the records: the count and count of the , how often a draw improved the hand, against the chance it would from the tiles still in the wall, and the . The site converts each into expected points and subtracts it. That removes 28% of the variance in a game's points: the standard deviation drops from 45.0 to 38.3. The rest of the luck, which tile the opponent drew, which wait got hit, stays in. A neural-network study on Tenhou data (MJ-DLVAT, cited on the site) removes about 45%, so the site calls its version the simple one.
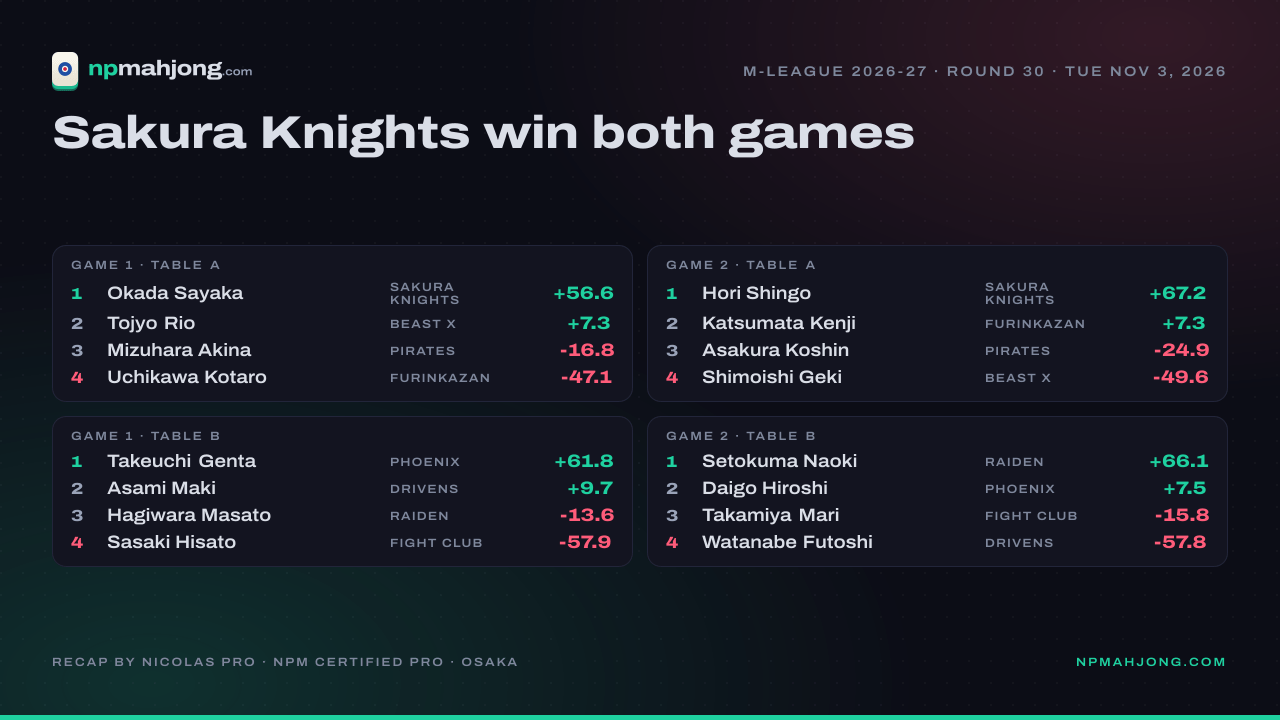
The season page ranks players by it. As of November 3, Setokuma's measured luck from deals, draws and ura dora was worth +20.9 points per game, the most in the league, and his actual score sat 38.0 points per game above his skill estimate. Hagiwara Masato was at the other end, -25.7 measured and -47.8 against his estimate. Across the 33 players with ten or more games, the gap between the best and worst actual result is 91.1 points per game. Between the best and worst skill estimate it's 5.3.
Standings odds from 20,000 seasons
The odds page runs the rest of the season again and again. Each remaining game draws a real past M-League result, four place scores, and deals them to the four teams on the published schedule. The deal is nudged by team skill, the average of the players' career skill estimates with luck removed. That nudge is a few points per game at most. The top six carry half their points into the semifinals, the top four of those into the finals, and the run records who finished where and who won.
| Team | Semifinals | Title |
|---|---|---|
| KADOKAWA Sakura Knights | 93% | 23% |
| KONAMI Mahjong Fight Club | 72% | 12% |
| Sega Sammy Phoenix | 68% | 12% |
| U-NEXT Pirates | 67% | 14% |
| Akasaka Drivens | 63% | 11% |
| TEAM RAIDEN | 62% | 7% |
| BEAST X | 61% | 7% |
| Shibuya ABEMAS | 47% | 6% |
| EARTH JETS | 35% | 4% |
| EX Furinkazan | 30% | 4% |
The site prints the caveats under the table. The teams differ in skill by about 1.0 point per game (one standard deviation), which over the 75 games each has left is worth about 78 points, against about 390 points of luck. The noise from 20,000 runs is at most 0.4 percentage points, but the errors in the skill estimates are larger and aren't in the figure. And the odds have never been checked against past seasons, because eight champions are too few to test on. A team the site shows at "0%" didn't reach that place in any of the runs. It isn't impossible.
The hand that decided each game
The page I'll use most is the one per game. It gives each player's chance of finishing first at the start of every hand, estimated by simulation from the scores, and the change each hand made to each player's expected final points. It marks the hand with the biggest swing as the one that decided the game.
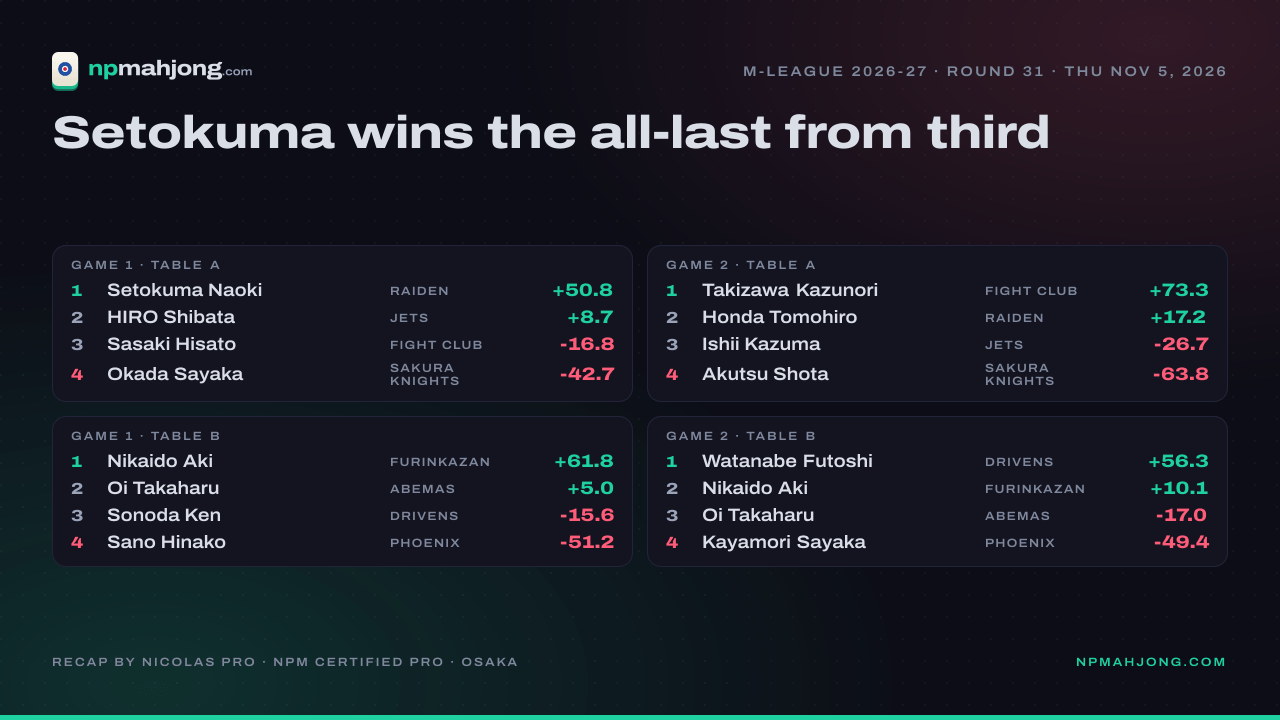
For table A, game 2 on November 3, that was not Hori Shingo's dealer in the . It was his 2,000/4,000 tsumo in south 1 with one , worth +27.5 to his expected score, because it came when the game was open. On table B the same night, Setokuma's 12,000 off Watanabe Futoshi in east 4 was worth +36.0. My recap had both hands, and the site's numbers put weights on them I couldn't have.
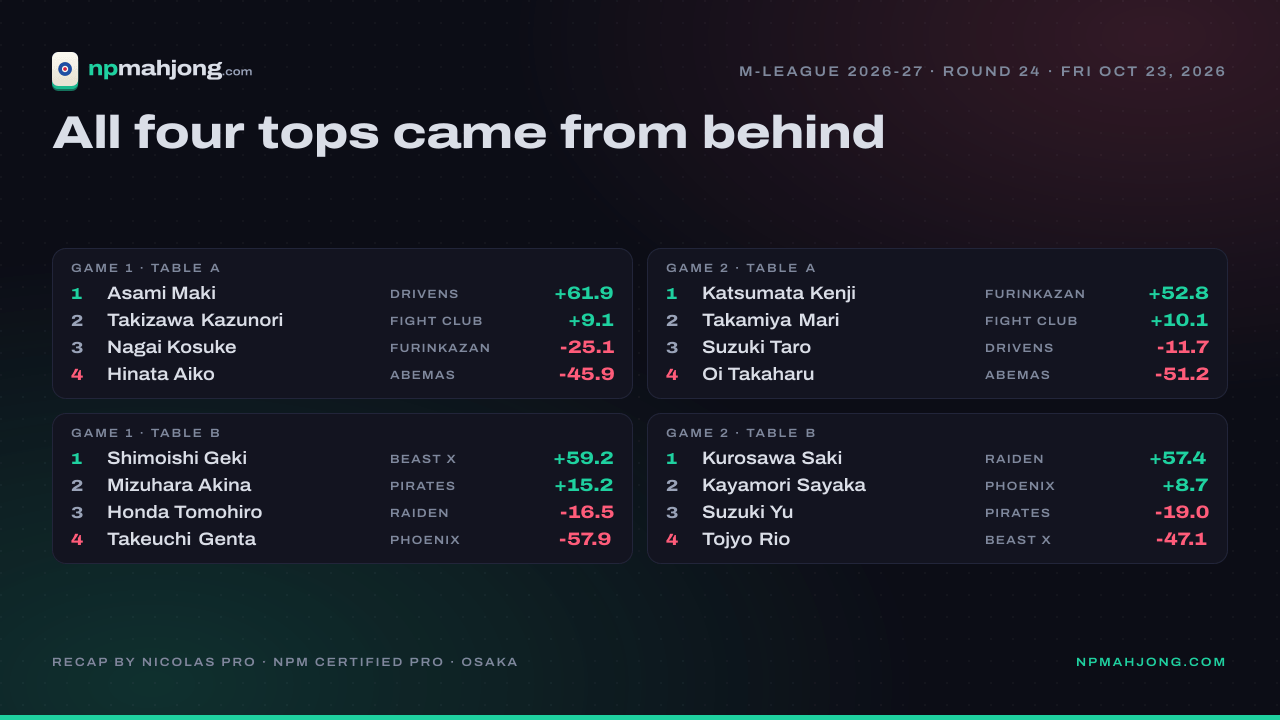
Starting with the next recap, each game section here ends with the hand M Data Lab's model says decided it, and the standings section carries its semifinal odds, each attributed to the site. M Data Lab rebuilds around noon Japan time the day after a match night, so the recaps now go out early in the afternoon, Japan time, instead of mid-morning.
Does it check itself?
The validation page decided it. It sets its pass lines before looking at the results and prints the failures. Four tests:
- Fake seasons with known answers. M Data Lab builds seasons from the real schedule with skills it chose, runs its own estimate, and counts how often the true value lands inside the 90% interval. Its first version missed in the test seasons with big skill gaps, 87% instead of 90%, because pulling everyone toward the average drags the strongest players too far. It switched to a 2022 method for drawing the intervals (Armstrong, Kolesár and Plagborg-Møller) and now meets 90% in all six test seasons.
- First half predicts second half. The shrunk estimates from a season's first half were tested on the second half of the same season. Pass.
- Shuffled labels. If the measured luck were skill in disguise, it would stay attached to players when the names are reshuffled. The test found no clear sign of that. The site also says how big a hidden player effect the test would catch: one explaining 20% of the spread about 99 times in 100, one explaining 10% about 76 times in 100.
- Calibration. When the model said 30% to finish first, the real rate was within 1.4 percentage points of that in any score situation.
The site prints its limits too. Skill is assumed constant within a season. The measured luck is only the part the records show.
What I take from it to my own table
The season table is mostly luck. A player gets about 23 games in a regular season by the site's count. That's about an eighth of the way to average place being half skill. When a pro has a bad season, it says less about them than the comments say. Your bad month on Tenhou works the same way.

Judge the decisions. Call rate settles fast. Five games and people know whether you call. Your deal-in rate needs 72 games to be half yours, so a reviewer reading it off your last 20 games is reading noise. What a reviewer can read in 20 games is every push and fold you made. That's what I read in a review.
Your sample is smaller than you think. Even Sasaki, with 313 games, the most in the league, has an average place the site puts at about 64% skill. If you have 100 ranked games on Mahjong Soul, your placement is still mostly the deal. Compare yourself on the metrics that settle: call rate in 5 games, deal-in rate in 72. Placement never gets there in a season.
Where to find it
M Data Lab in English: the standings odds, the player pages, the 2026-27 season with the luck rankings, and a page for every game.
Its banner says most differences in results are within chance, and they are no grounds for criticizing players. Open your last 20 games and count the pushes and folds.
Sources
M Data Lab's about page (data, rules, coverage), its column on luck and skill (the 88%, the games-to-half-skill table, the 28%), the methodology (the shrinkage formula, the Sasaki and Setokuma examples, the simulation), the validation page (the four tests, and those three pages sit under /en/ but are written in Japanese), the odds page and the 2026-27 season page as of November 3, and the game pages for November 3, table A game 2 and table B game 2. The operator's note on the noon rebuild is from email, November 6.
Was this article helpful?